
Here is a Google-produced map of the world that shows Android activations over time.You can see how handset launches have impackted on uptake with countdown timers — “Droid launch in 3, 2, 1” and also the activations are broken down by continent for easier viewing. Via:[engadget]
IS IT ART? VIDEO:Visualized: Android activations mapped geographically, chronologically, breathtakingly

Related Posts
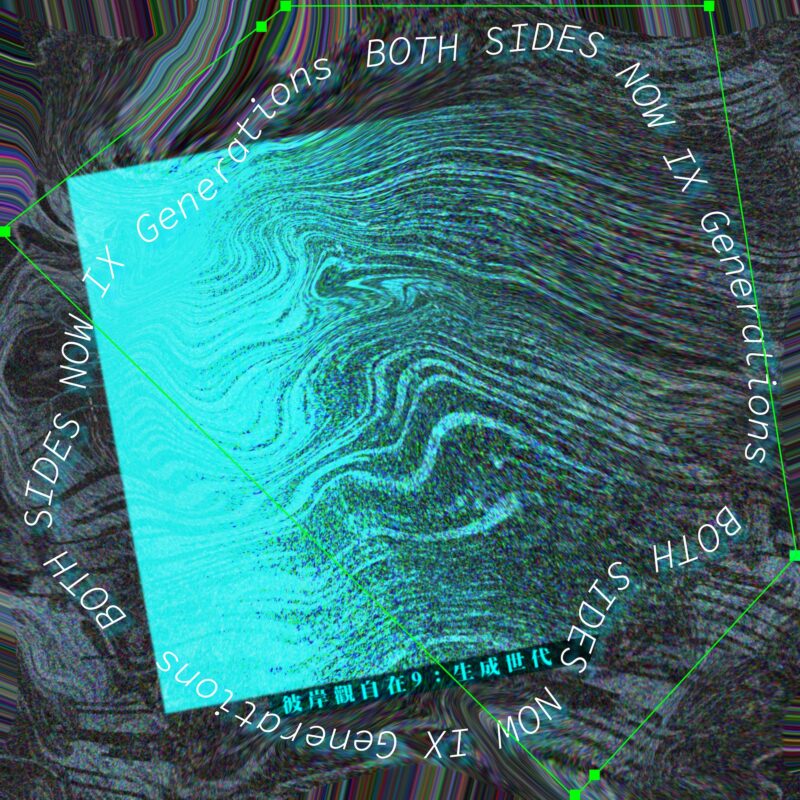
Curated international film & video programme to examine AI’s creative & cultural implications on a global scale.
Both Sides Now 9: Generations is a curated programme of international film & video examining AI’s creative and cultural implications on […]
What Are the Key Advantages of Cloud Backup Services?
All businesses these days have to think carefully about the tools and services that they invest in for the business. […]
The most effective method to Download Videos From Facebook And Twitter
There is no question that FB and Twitter these days are viewed as the most impressive informal organization where a […]

The 6 artists shortlisted for the Fourth Plinth announced.
The Mayor of London, Sadiq Khan, today announced the six artists who have been shortlisted for Trafalgar Square’s Fourth Plinth […]
Trending Articles
 The Royal College of Art number 1 university for art & design for 10th year in a row RCA Battersea campus building, 2022, Photo: Iwan Baan - Royal College of Art number 1 university for Art & Design…
 Maurizio Cattelan to stage his first gallery exhibition in more than twenty years. MAURIZIO CATTELAN Photo: Courtesy the artist Gagosian is pleased to announce Maurizio Cattelan’s first solo gallery exhibition in more than…
 The Literacy Pen by The World Literacy Foundation + Media.Monks We Love the Literacy Pen: A groundbreaking educational tool developed by The World Literacy Foundation and Media.Monks. Designed to empower…
 The Top Art Books to read this Spring Creative children, abandoned places, computing, war, Play-Doh, Warhol, masterpieces and social media.